On average we live longer
Life expectancy has increased markedly over the past 30 years. Figures for the five-year period 2006/2010 shows that newborn boys now can expect to live 67.8 years and newborn girls 5 years longer namely 72.8 years. This is 8 years longer for men compared with early 1980’ies and 6 years longer for women. Despite this increase, it remains the Nordic record low.
One reason to explain the low life expectancy is the many suicides. In the period 1980-2009 1474 people chose commit suicide. In just the past 10 years, a number of persons representing the entire population of a small Greenlandic town - or as many as once lived in the soon demolished Block P in Nuuk - killed themself.
Compared to population size 7,4 times as many commit suicide in Greenland as in Denmark. Could this loss of human lives have been avoided, the average life expectancy would be higher. Of the 1474 suicides only 30 were committed by persons over 65 years.
This information and much more can be found in 3 new tables in our Statbank
http://bank.stat.gl/BEEDT Mortality tables by base, time, age, gender and type
http://bank.stat.gl/BEELD1 Cause of death by time, district, dk-list, gender and age 1968-2009
http://bank.stat.gl/BEELD2 Cause of death by district, residence, dk-list and gender 1968-2009
The 2 new tables on causes of death have been prepared in cooperation with the National Board of Health, and a coherent detailed table for the entire period 1968-2009 has been established. The tables will be updated annually.
Figures in our Statbank
With this publication our presentation of population statistics continues to integrate our homepage (www.stat.gl) and our Statbank ( http://bank.stat.gl ).
We aim to give access to very detailed statistical information’s and give our users an easy way to define and download tables. Updated figures will be found in the Statbank in Danish, Greenlandic and English.
On population we can present detailed, coherent and consistent statistical information for:
Population estimates: 1977-2011
Births: 1973-2010
Deaths: 1973-2010
Cause of Deaths: 1968-2009
Migration*: 1993-2010
Internal migration*: 1993-2010
* We have raw register data for 1981-1992 and hope to integrate later.
In creating these tables the present administrative subdivision has been used and municipalities are as defined January 1st 2009. At lower levels we use 2 concepts; districts are equivalent with municipalities prior to 2009 and localities. A locality is a place and can be any town, settlement, station, mine and can be inhabited or not. For definition we use the one ASIAQ (www.asiaq.gl) has determined. The Asiaq list on localities is as of now not complete with regards to historical localities.
To ensure consistency at detailed levels we have revised our data once again. Some minor inconsistencies have been corrected, and some differences can be found in comparing the revised tables with previously publications.
For fast access to a relevant table in the Statbank, links are found below each table and graph on the following pages.
Overview 1. Population January 1st by gender, 2002-2011
|
|
2003 |
2004 |
2005 |
2006 |
2007 |
2008 |
2009 |
2010 |
2011 |
|
Total |
56.676 |
56.854 |
56.969 |
56.901 |
56.648 |
56.462 |
56.194 |
56.452 |
56.615 |
|
Men |
30.249 |
30.335 |
30.319 |
30.182 |
30.005 |
29.885 |
29.809 |
29.936 |
29.942 |
|
Women |
26.427 |
26.519 |
26.650 |
26.719 |
26.643 |
26.577 |
26.385 |
26.516 |
26.673 |
Visit our Statbank: ( http://bank.stat.gl/beest1 )
During 2010 total population rose by 163 persons. This is due to these changes:
Overview 2. Changes to the population in 2010
|
Population estimate January 1st 2010 |
56.453 |
|
+ births |
868 |
|
- deaths |
-510 |
|
+ immigrated |
2.491 |
|
- emigrated |
-2.651 |
|
- corrections |
-35 |
|
Population estimate January 1st 2011 |
56.615 |
In the Statbank you can combine information on residence, gender, mother’s age and place of birth from 1977 and onward. Geographically you can choose between municipalities, districts and localities. The most detailed table holds half a million table cells.
Overview 3. Births in the municipalities 2008-2010
|
|
2008 |
2009 |
2010 |
|
|
|
||
|
Total |
834 |
895 |
868 |
|
Kujalleq |
110 |
121 |
115 |
|
Sermersooq |
297 |
345 |
333 |
|
Qeqqata |
163 |
149 |
133 |
|
Qaasuitsup |
264 |
280 |
287 |
Visit our Statbank: ( http://bank.stat.gl/BEEBBLM2 )
From overview 3 we learn that 868 children were born in 2010, which are 27 fewer compared to 2009. The relatively small birth cohorts from the mid-seventies has for most now completed their fertile period. They will be replaced by relatively larger birth cohorts in the coming years.
The fertility pattern has been unchanged with total fertility above reproduction level. Graph 1 shows the total fertility rates over the past 10 years. There are no major differences at the municipal level. But large differences can be found between towns and settlements. Visit our Statbank: http://bank.stat.gl/BEEBBSF2
Graph 1 Total fertility rates selected population groups 1977-2010
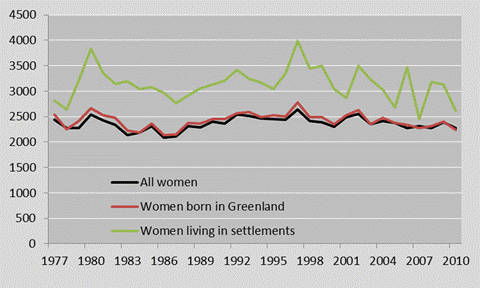
Visit our Statbank: ( http://bank.stat.gl/BEEFT )
Overview 4 Death in the municipalities 2009-2010
|
|
Men |
Women |
Total |
||||
|
|
2009 |
2010 |
2009 |
2010 |
2009 |
2010 |
|
|
|
|||||||
|
Total |
|
|
|
|
|
|
|
|
Total |
188 |
204 |
249 |
306 |
437 |
510 |
|
|
Towns |
156 |
166 |
210 |
252 |
366 |
418 |
|
|
Settlements |
32 |
38 |
39 |
54 |
71 |
92 |
|
|
Kujalleq |
|
|
|
|
|
|
|
|
Total |
34 |
33 |
55 |
47 |
89 |
80 |
|
|
Towns |
28 |
30 |
44 |
38 |
72 |
68 |
|
|
Settlements |
6 |
3 |
11 |
9 |
17 |
12 |
|
|
Sermersooq |
|
|
|
|
|
||
|
Total |
59 |
64 |
80 |
99 |
139 |
163 |
|
|
Towns |
50 |
47 |
73 |
87 |
123 |
134 |
|
|
Settlements |
9 |
17 |
7 |
12 |
16 |
29 |
|
|
Qeqqata |
|
|
|
|
|
|
|
|
Total |
29 |
35 |
27 |
45 |
56 |
80 |
|
|
Towns |
27 |
32 |
22 |
42 |
49 |
74 |
|
|
Settlements |
2 |
3 |
5 |
3 |
7 |
6 |
|
|
Qaasuitsup |
|
|
|
|
|
||
|
Total |
66 |
72 |
85 |
115 |
151 |
187 |
|
|
Towns |
51 |
57 |
71 |
85 |
122 |
142 |
|
|
Settlements |
15 |
15 |
14 |
30 |
29 |
45 |
|
Visit our Statbank: ( http://bank.stat.gl/beebbdm2 )
In the graph below the number of migrations by gender and place of birth 2000-2010 can be seen. Every year more people choose to emigrate than to immigrate. In 2010 2.491 persons immigrated while 2.651 persons emigrated.
Graph 2 Migrations 2000-2010
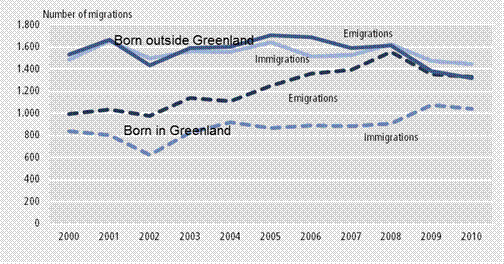
Visit our Statbank: ( http://bank.stat.gl/beebbiu2 )
22.313 changes of addresses were counted in 2010, which is at same level as for the past 5 years. Most moving’s takes place within the same locality.
Overview 5 Internal migrations 2010
|
|
Kujalleq |
Sermersooq |
Qeqqata |
Qaasuitsup |
Other localities |
Municipality of removal total |
|
Municipality of migration |
3.524 |
8.174 |
3.987 |
6.608 |
20 |
22.313 |
|
Kujalleq |
2.996 |
354 |
130 |
139 |
2 |
3.621 |
|
Sermersooq |
314 |
6.801 |
468 |
445 |
9 |
8.037 |
|
Qeqqata |
95 |
491 |
3.019 |
303 |
3 |
3.911 |
|
Qaasuitsup |
117 |
522 |
366 |
5.717 |
6 |
6.728 |
|
Other localities |
2 |
6 |
4 |
4 |
- |
16 |
Visit our Statbank: ( http://bank.stat.gl/beebaf2b )
Graph 3 Net internal migrations in the municipalities 1993-2010
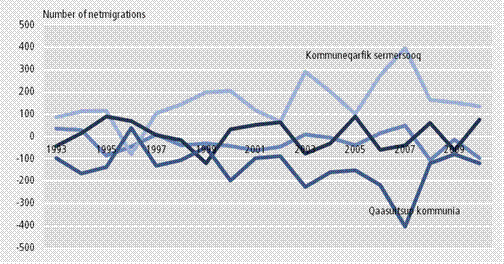
Visit our Statbank: ( http://bank.stat.gl/beebbaf2 )